Basic example
Contents
Basic example#
Let’s use EOReader for the first time.
Imports#
import os

# EOReader
from eoreader.reader import Reader
from eoreader.bands import *
Data#
First of all, we need some satellite data.
Let’s open a Sentinel-2 product.
path = os.path.join("/home", "data", "DATA", "PRODS", "S2", "PB 02.07+", "S2B_MSIL2A_20200114T065229_N0213_R020_T40REQ_20200114T094749.SAFE")
Create the Reader#
First, create the Reader object.
This object will automatically detect the type of sensor of your product.
It relies on the internal composition of the product (usually the presence of the metadata file), so please do not remove them.
The Reader is a singleton that should be called only once.
It can be used several times to open all your satellite products.
No need to extract the product here: archived Sentinel-2 are handled by EOReader.
reader = Reader()
Open the product#
The reader is used to open your product, just call the open function.
prod = reader.open(path)
prod
EOReader S2Product
Attributes:
	condensed_name: 20200114T065229_S2_T40REQ_L2A_094749
	name: S2B_MSIL2A_20200114T065229_N0213_R020_T40REQ_20200114T094749
	path: /home/data/DATA/PRODS/S2/PB 02.07+/S2B_MSIL2A_20200114T065229_N0213_R020_T40REQ_20200114T094749.SAFE
	platform: Sentinel-2
	sensor type: Optical
	product type: MSIL2A
	default resolution: 10.0
	acquisition datetime: 2020-01-14T06:52:29
	band mapping:
		COASTAL_AEROSOL: 01
		BLUE: 02
		GREEN: 03
		RED: 04
		VEGETATION_RED_EDGE_1: 05
		VEGETATION_RED_EDGE_2: 06
		VEGETATION_RED_EDGE_3: 07
		NIR: 08
		NARROW_NIR: 8A
		WATER_VAPOUR: 09
		SWIR_1: 11
		SWIR_2: 12
	tile name: T40REQ
	needs_extraction: False
Load#
Just load easily some bands and index. The load function outputs a dictionary of xarray.DataArray.
# Load those bands as a dict of xarray.DataArray
band_dict = prod.load([GREEN, NDVI, CLOUDS])
green = band_dict[GREEN]
ndvi = band_dict[NDVI]
clouds = band_dict[CLOUDS]

print(green)
<xarray.DataArray 'GREEN' (band: 1, y: 10980, x: 10980)>
array([[[0.1034, 0.1134, 0.1064, ...,    nan,    nan,    nan],
        [0.0969, 0.0895, 0.1094, ...,    nan,    nan,    nan],
        [0.1132, 0.0959, 0.1082, ...,    nan,    nan,    nan],
        ...,
        [1.488 , 1.4416, 1.3888, ...,    nan,    nan,    nan],
        [1.468 , 1.4472, 1.4072, ...,    nan,    nan,    nan],
        [1.4168, 1.4072, 1.4   , ...,    nan,    nan,    nan]]],
      dtype=float32)
Coordinates:
  * band         (band) int64 1
  * x            (x) float64 5e+05 5e+05 5e+05 ... 6.098e+05 6.098e+05 6.098e+05
  * y            (y) float64 3e+06 3e+06 3e+06 ... 2.89e+06 2.89e+06 2.89e+06
    spatial_ref  int64 0
Attributes:
    long_name:         GREEN
    sensor:            Sentinel-2
    sensor_id:         S2
    product_path:      /home/data/DATA/PRODS/S2/PB 02.07+/S2B_MSIL2A_20200114...
    product_name:      S2B_MSIL2A_20200114T065229_N0213_R020_T40REQ_20200114T...
    product_filename:  S2B_MSIL2A_20200114T065229_N0213_R020_T40REQ_20200114T...
    product_type:      MSIL2A
    acquisition_date:  20200114T065229
    condensed_name:    20200114T065229_S2_T40REQ_L2A_094749
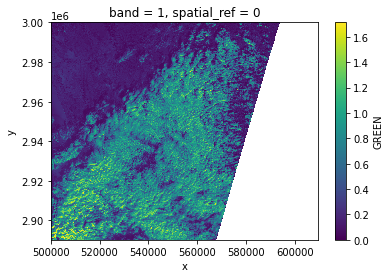
# Plot a subsampled version
green[:, ::10, ::10].plot()
<matplotlib.collections.QuadMesh at 0x7fd0c0ebf760>
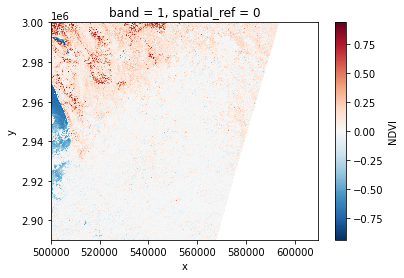
# Plot a subsampled version
ndvi[:, ::10, ::10].plot()
<matplotlib.collections.QuadMesh at 0x7fd0c0d4e460>
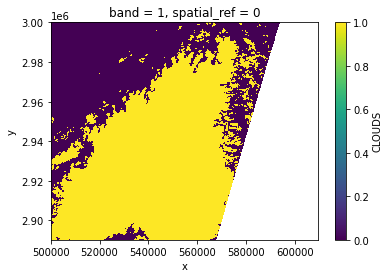
# Plot a subsampled version
clouds[:, ::10, ::10].plot()
<matplotlib.collections.QuadMesh at 0x7fd0c0c847f0>