S3 Compatible Storage
S3 Compatible Storage
Let’s use EOReader with products stored in a S3 compatible storage cloud.
This tutorial is a bit tricky as EOReader uses rasterio and cloudpathlib libraries and they are currently handling S3 buckets differently.
Note: This is experimental for now, use it at your own risk !
Warning:
AWS_ACCESS_KEY_ID and AWS_SECRET_ACCESS_KEY as environment variables
# Imports
import os
from cloudpathlib import S3Client, AnyPath
import matplotlib.pyplot as plt

import rasterio

from eoreader.reader import Reader
from eoreader.bands import *

# Other
AWS_S3_ENDPOINT = os.getenv("AWS_S3_ENDPOINT")
# Create your S3 compatible storage path with cloudpathlib
# See here for more insights about this awesome lib: https://cloudpathlib.drivendata.org/
client = S3Client(
    endpoint_url=f"https://{AWS_S3_ENDPOINT}",
    aws_access_key_id=os.getenv("AWS_ACCESS_KEY_ID"),
    aws_secret_access_key=os.getenv("AWS_SECRET_ACCESS_KEY"),
)
client.set_as_default_client()
path = AnyPath("s3://sertit-eoreader-ci").joinpath(
    "optical/S2B_MSIL2A_20200114T065229_N0213_R020_T40REQ_20200114T094749.SAFE/")
# Create an rasterio env to enable S3 compatible storage
with rasterio.Env(
CPL_CURL_VERBOSE=False,
AWS_VIRTUAL_HOSTING=False,
AWS_S3_ENDPOINT=AWS_S3_ENDPOINT,
GDAL_DISABLE_READDIR_ON_OPEN=False,
):
# Create the reader
eoreader = Reader()
# Open your product
prod = eoreader.open(path, remove_tmp=True) # No need to unarchive here
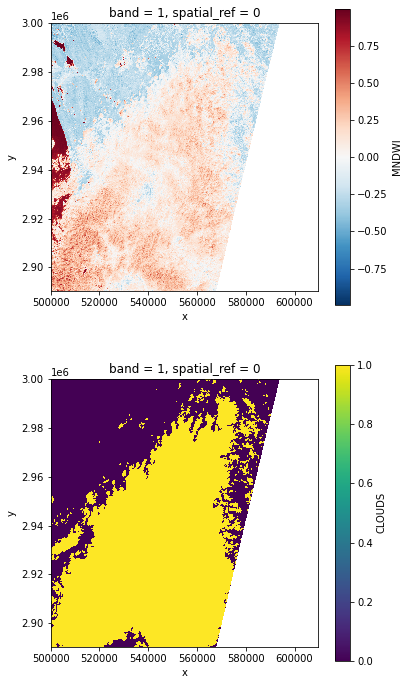
# Load this band
band_dict = prod.load([MNDWI, CLOUDS])
# Display
nrows = len(band_dict)
fig, axes = plt.subplots(nrows=nrows, figsize=(3 * nrows, 6 * nrows), subplot_kw={"box_aspect": 1})  # Square plots
for i, band in enumerate(band_dict.values()):
    band[::10, ::10].plot(x="x", y="y", ax=axes[i])