Basic example
Basic example
Let’s use EOReader for the first time !
import os

# First of all, we need some satellite data.
# Let's open a lightweight a Landsat-5 TM collection 2 tile.
path = os.path.join("/home", "data", "DATA", "PRODS", "LANDSATS_COL2", "LT05_L1TP_200030_20111110_20200820_02_T1.tar")
from eoreader.reader import Reader

# Create the reader
# This reader is a singleton can be called once and then open all your data.
eoreader = Reader()
# Open your product
# No need to extract the product here: Archived Landsat-5 Collection are handled by EOReader
prod = eoreader.open(path)
# Here you have opened your product and you have its object in hands
# You can play a little with it to see what it got inside
print(f"Landsat tile: {prod.tile_name}")
print(f"Acquisition datetime: {prod.datetime}")
Landsat tile: 200030
Acquisition datetime: 2011-11-10 10:36:12
# Retrieve the UTM CRS of the tile
prod.crs
CRS.from_epsg(32630)
# Open here some more interesting geographical data: extent and footprint
base = prod.extent.plot(color='cyan', edgecolor='black')
prod.footprint.plot(ax=base, color='blue', edgecolor='black', alpha=0.5)
<AxesSubplot:>
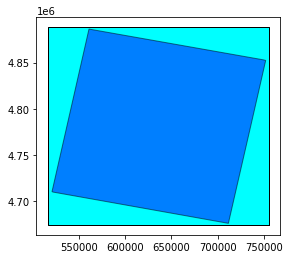
See the difference between footprint and extent hereunder:
Without nodata |
With nodata |
|---|---|
|
|
from eoreader.bands import *
from eoreader.env_vars import DEM_PATH

# Select the bands you want to load
bands = [GREEN, NDVI, YELLOW, CLOUDS]

# Compute DEM band only if you have set a DEM in your environment path
if DEM_PATH in os.environ:
    bands.append(HILLSHADE)

# Be sure they exist for Landsat-5 TM sensor:
ok_bands = [band for band in bands if prod.has_band(band)]
print(to_str(ok_bands))  # Landsat-5 TM doesn't provide YELLOW band
['GREEN', 'NDVI', 'CLOUDS']
# Load those bands as a dict of xarray.DataArray
band_dict = prod.load(ok_bands)
band_dict[GREEN]
<xarray.DataArray 'GREEN' (band: 1, y: 7131, x: 7991)>
array([[[nan, nan, nan, ..., nan, nan, nan],
        [nan, nan, nan, ..., nan, nan, nan],
        [nan, nan, nan, ..., nan, nan, nan],
        ...,
        [nan, nan, nan, ..., nan, nan, nan],
        [nan, nan, nan, ..., nan, nan, nan],
        [nan, nan, nan, ..., nan, nan, nan]]], dtype=float32)
Coordinates:
  * band         (band) int64 1
  * x            (x) float64 5.16e+05 5.16e+05 5.161e+05 ... 7.557e+05 7.557e+05
  * y            (y) float64 4.888e+06 4.888e+06 ... 4.674e+06 4.674e+06
    spatial_ref  int64 0
Attributes:
    long_name:         GREEN
    sensor:            Landsat-5
    sensor_id:         L5
    product_path:      /home/data/DATA/PRODS/LANDSATS_COL2/LT05_L1TP_200030_2...
    product_name:      LT05_L1TP_200030_20111110_20200820_02_T1
    product_filename:  LT05_L1TP_200030_20111110_20200820_02_T1
    product_type:      TM
    acquisition_date:  20111110T103612
condensed_name: 20111110T103612_L5_200030_TM# The nan corresponds to the nodata you see on the footprint
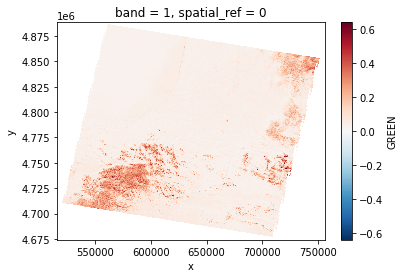
# Plot a subsampled version
band_dict[GREEN][:, ::10, ::10].plot()
<matplotlib.collections.QuadMesh at 0x7f9456064910>
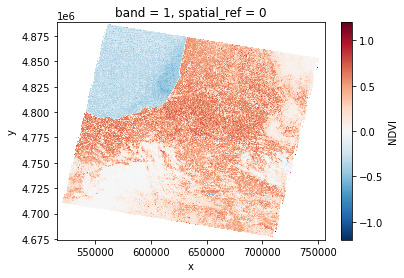
# Plot a subsampled version
band_dict[NDVI][:, ::10, ::10].plot()
<matplotlib.collections.QuadMesh at 0x7f945ec941f0>
# Plot a subsampled version
if HILLSHADE in band_dict:
    band_dict[HILLSHADE][:, ::10, ::10].plot()
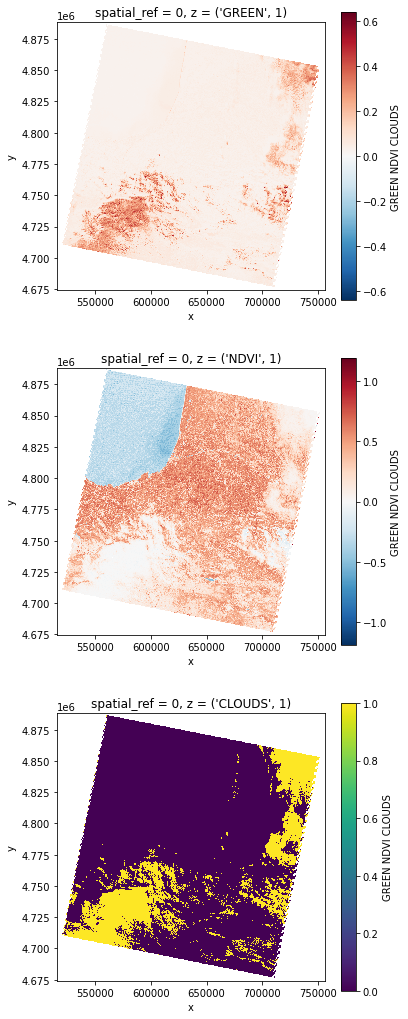
# You can also stack those bands
stack = prod.stack(ok_bands)
stack
<xarray.DataArray 'GREEN NDVI CLOUDS' (z: 3, y: 7131, x: 7991)>
array([[[nan, nan, nan, ..., nan, nan, nan],
        [nan, nan, nan, ..., nan, nan, nan],
        [nan, nan, nan, ..., nan, nan, nan],
        ...,
        [nan, nan, nan, ..., nan, nan, nan],
        [nan, nan, nan, ..., nan, nan, nan],
        [nan, nan, nan, ..., nan, nan, nan]],

       [[nan, nan, nan, ..., nan, nan, nan],
        [nan, nan, nan, ..., nan, nan, nan],
        [nan, nan, nan, ..., nan, nan, nan],
        ...,
        [nan, nan, nan, ..., nan, nan, nan],
        [nan, nan, nan, ..., nan, nan, nan],
        [nan, nan, nan, ..., nan, nan, nan]],

       [[nan, nan, nan, ..., nan, nan, nan],
        [nan, nan, nan, ..., nan, nan, nan],
        [nan, nan, nan, ..., nan, nan, nan],
        ...,
        [nan, nan, nan, ..., nan, nan, nan],
        [nan, nan, nan, ..., nan, nan, nan],
        [nan, nan, nan, ..., nan, nan, nan]]], dtype=float32)
Coordinates:
    spatial_ref  int64 0
  * x            (x) float64 5.16e+05 5.16e+05 5.161e+05 ... 7.557e+05 7.557e+05
  * y            (y) float64 4.888e+06 4.888e+06 ... 4.674e+06 4.674e+06
  * z            (z) MultiIndex
  - variable     (z) object 'GREEN' 'NDVI' 'CLOUDS'
  - band         (z) int64 1 1 1
Attributes:
    long_name:         GREEN NDVI CLOUDS
    sensor:            Landsat-5
    sensor_id:         L5
    product_path:      /home/data/DATA/PRODS/LANDSATS_COL2/LT05_L1TP_200030_2...
    product_name:      LT05_L1TP_200030_20111110_20200820_02_T1
    product_filename:  LT05_L1TP_200030_20111110_20200820_02_T1
    product_type:      TM
    acquisition_date:  20111110T103612
condensed_name: 20111110T103612_L5_200030_TM# Plot a subsampled version
import matplotlib.pyplot as plt
nrows = len(stack)
fig, axes = plt.subplots(nrows=nrows, figsize=(2 * nrows, 6 * nrows), subplot_kw={"box_aspect": 1}) # Square plots
for i in range(nrows):
stack[i, ::10, ::10].plot(x="x", y="y", ax=axes[i])