VHR example#
Let’s use EOReader with Very High Resolution data.
Imports#
import os

# EOReader
from eoreader.reader import Reader
from eoreader.bands import GREEN, NDVI, TIR_1, CLOUDS, HILLSHADE, to_str
from eoreader.env_vars import DEM_PATH
Create the logger#
# Create logger
import logging
from sertit import logs

logger = logging.getLogger("eoreader")
logs.init_logger(logger)
Open the VHR product#
Please be aware that EOReader will always work in UTM projection.
So if you give WGS84 data, EOReader will reproject the stacks and this can be time-consuming
# Set a DEM as we will load some DEM bands
os.environ[DEM_PATH] = os.path.join(
    "/home", "ds2_db2", "BASES_DE_DONNEES", "GLOBAL", "COPDEM_30m", "COPDEM_30m.vrt"
)

# Open your product
path = os.path.join("/home", "prods", "PLEIADES", "5547047101", "IMG_PHR1A_PMS_001")
reader = Reader()
prod = reader.open(path, remove_tmp=True)
prod
eoreader.PldProduct 'PHR1A_PMS_202005110231585_ORT_5547047101'
Attributes:
	condensed_name: 20200511T023158_PLD_ORT_PMS_5547047101
	path: /home/prods/PLEIADES/5547047101/IMG_PHR1A_PMS_001
	constellation: Pleiades
	sensor type: Optical
	product type: Ortho Single Image
	default pixel size: 0.5
	default resolution: 0.5
	acquisition datetime: 2020-05-11T02:31:58
	band mapping:
		BLUE: 3
		GREEN: 2
		RED: 1
		NIR: 4
		NARROW_NIR: 4
	needs extraction: False
	cloud cover: 0.0
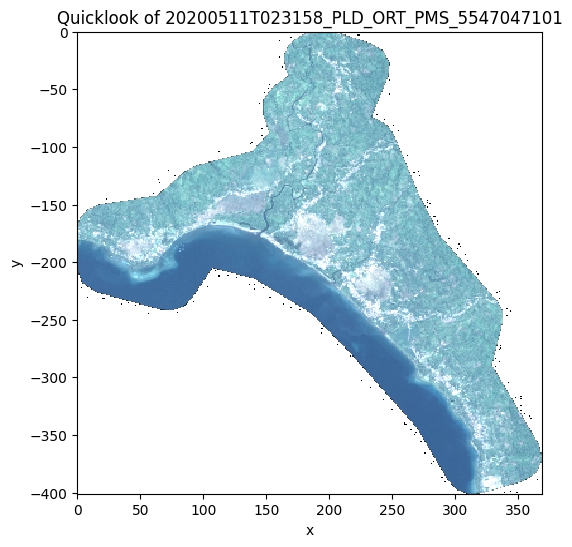
# Plot the quicklook.
# The quicklook is not georeferenced
prod.plot(nodata=0)
/opt/conda/lib/python3.11/site-packages/rasterio/__init__.py:356: NotGeoreferencedWarning: Dataset has no geotransform, gcps, or rpcs. The identity matrix will be returned.
  dataset = DatasetReader(path, driver=driver, sharing=sharing, **kwargs)
# Get the bands information
prod.bands
eoreader.SpectralBand 'RED'
Attributes:
	id: 1
	eoreader_name: RED
	common_name: red
	gsd (m): 0.5
	asset_role: reflectance
	Center wavelength (nm): 650.0
	Bandwidth (nm): 120.0
eoreader.SpectralBand 'GREEN'
Attributes:
	id: 2
	eoreader_name: GREEN
	common_name: green
	gsd (m): 0.5
	asset_role: reflectance
	Center wavelength (nm): 560.0
	Bandwidth (nm): 120.0
eoreader.SpectralBand 'BLUE'
Attributes:
	id: 3
	eoreader_name: BLUE
	common_name: blue
	gsd (m): 0.5
	asset_role: reflectance
	Center wavelength (nm): 495.0
	Bandwidth (nm): 70.0
eoreader.SpectralBand 'NIR'
Attributes:
	id: 4
	eoreader_name: NIR
	common_name: nir
	gsd (m): 0.5
	asset_role: reflectance
	Center wavelength (nm): 840.0
	Bandwidth (nm): 200.0
eoreader.SpectralBand 'NIR'
Attributes:
	id: 4
	eoreader_name: NIR
	common_name: nir
	gsd (m): 0.5
	asset_role: reflectance
	Center wavelength (nm): 840.0
	Bandwidth (nm): 200.0
# The acquisition datetime of the Pleidaes image
print(f"Acquisition datetime: {prod.datetime}")
Acquisition datetime: 2020-05-11 02:31:58
# The condensed name of the Pleiade image:
# this is a unified and compact way of naming all EOReader products in the same fashion
print(f"Condensed name: {prod.condensed_name}")
Condensed name: 20200511T023158_PLD_ORT_PMS_5547047101
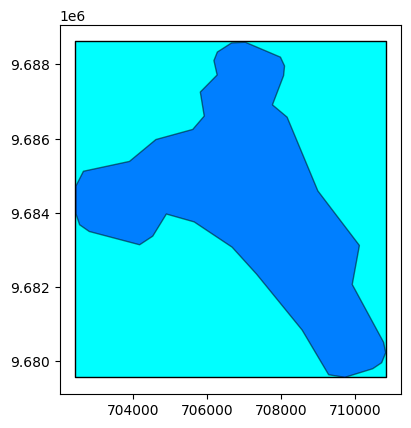
# Open here some more interesting geographical data: extent and footprint
extent = prod.extent()
footprint = prod.footprint()

base = extent.plot(color='cyan', edgecolor='black')
footprint.plot(ax=base, color='blue', edgecolor='black', alpha=0.5)
<Axes: >
Here, if you want to orthorectify or pansharpen your data manually, you can set your stack here.
prod.ortho_stack = "/path/to/ortho_stack.tif"
If you do not provide this stack, but you give a non-orthorectified product to EOReader
(i.e. SEN or PRJ products for Pleiades), you must provide a DEM to orthorectify correctly the data.
⚠️⚠️⚠️
DIMAP SEN products are orthorectified using RPCs. Be sure to use a DEM with a knwon vertical CRS.
If not allready Ellipsoid-based, such as the COPDEM-30, the vertical CRS will be reprojected to Ellipsoid.
Load some bands#
# Select the bands you want to load
bands = [GREEN, NDVI, TIR_1, CLOUDS, HILLSHADE]

# Be sure they exist for Pleiades sensor
ok_bands = [band for band in bands if prod.has_band(band)]
print(to_str(ok_bands))  # Pleiades doesn't provide TIR and SHADOWS bands
['GREEN', 'NDVI', 'CLOUDS', 'HILLSHADE']
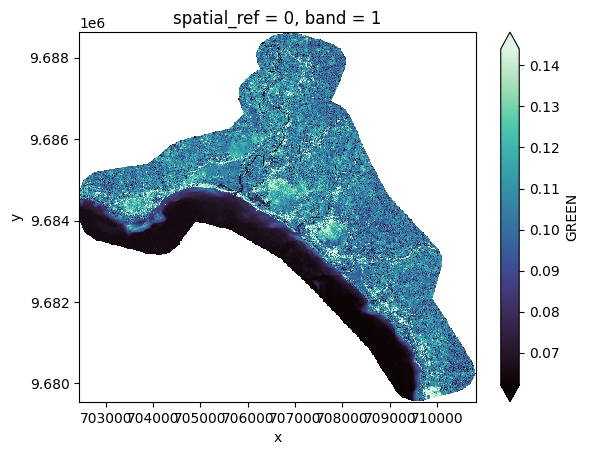
# Load those bands as a xarray.Dataset
band_ds = prod.load(ok_bands, pixel_size=2.0)
band_ds[GREEN]
2025-12-23 11:27:14,651 - [DEBUG] - Loading bands ['GREEN', 'NIR', 'RED']
2025-12-23 11:27:14,654 - [DEBUG] - Read GREEN
2025-12-23 11:27:14,682 - [INFO] - Warping DIM_PHR1A_PMS_202005110231585_ORT_5547047101 to UTM with a 2.0 m pixel size.
2025-12-23 11:27:14,726 - [DEBUG] - Writing warped band to /tmp/tmpd3solkcx/tmp_20200511T023158_PLD_ORT_PMS_5547047101/20200511T023158_PLD_ORT_PMS_5547047101_2m.vrt
2025-12-23 11:27:14,753 - [DEBUG] - Reading warped GREEN.
2025-12-23 11:27:14,809 - [DEBUG] - Manage nodata for band GREEN
2025-12-23 11:27:14,810 - [DEBUG] - Load nodata
2025-12-23 11:27:14,911 - [DEBUG] - Rasterizing ROI mask
2025-12-23 11:27:15,281 - [DEBUG] - Set nodata mask
2025-12-23 11:27:15,330 - [DEBUG] - Converting GREEN to reflectance (if needed)
2025-12-23 11:27:15,342 - [DEBUG] - Clip the reflectance array to 0 as minimum value (in some cases, reflectance can have higher value than 1)
2025-12-23 11:28:04,303 - [DEBUG] - Read NIR
2025-12-23 11:28:04,332 - [DEBUG] - Reading warped NIR.
2025-12-23 11:28:04,384 - [DEBUG] - Manage nodata for band NIR
2025-12-23 11:28:04,384 - [DEBUG] - Load nodata
2025-12-23 11:28:04,403 - [DEBUG] - Set nodata mask
2025-12-23 11:28:04,405 - [DEBUG] - Converting NIR to reflectance (if needed)
2025-12-23 11:28:04,409 - [DEBUG] - Clip the reflectance array to 0 as minimum value (in some cases, reflectance can have higher value than 1)
2025-12-23 11:28:59,015 - [DEBUG] - Read RED
2025-12-23 11:28:59,043 - [DEBUG] - Reading warped RED.
2025-12-23 11:28:59,093 - [DEBUG] - Manage nodata for band RED
2025-12-23 11:28:59,094 - [DEBUG] - Load nodata
2025-12-23 11:28:59,111 - [DEBUG] - Set nodata mask
2025-12-23 11:28:59,113 - [DEBUG] - Converting RED to reflectance (if needed)
2025-12-23 11:28:59,117 - [DEBUG] - Clip the reflectance array to 0 as minimum value (in some cases, reflectance can have higher value than 1)
2025-12-23 11:29:53,992 - [DEBUG] - Loading indices ['NDVI']
2025-12-23 11:31:20,336 - [DEBUG] - Loading DEM bands ['HILLSHADE']
2025-12-23 11:31:20,337 - [DEBUG] - Warping DEM for 20200511T023158_PLD_ORT_PMS_5547047101
2025-12-23 11:31:20,340 - [DEBUG] - Using DEM: /home/ds2_db2/BASES_DE_DONNEES/GLOBAL/COPDEM_30m/COPDEM_30m.vrt
2025-12-23 11:31:23,257 - [DEBUG] - Computing hillshade DEM for PHR1A_PMS_202005110231585_ORT_5547047101
2025-12-23 11:31:34,220 - [DEBUG] - Loading Cloud bands ['CLOUDS']
index 0 is out of bounds for axis 0 with size 0
<xarray.DataArray <SpectralBandNames.GREEN: 'GREEN'> (band: 1, y: 4531, x: 4189)> Size: 76MB
dask.array<clip, shape=(1, 4531, 4189), dtype=float32, chunksize=(1, 1024, 1024), chunktype=numpy.ndarray>
Coordinates:
    spatial_ref  int64 8B 0
  * band         (band) int64 8B 1
  * y            (y) float64 36kB 9.689e+06 9.689e+06 ... 9.68e+06 9.68e+06
  * x            (x) float64 34kB 7.024e+05 7.025e+05 ... 7.108e+05 7.108e+05
Attributes: (12/14)
    path:              /tmp/tmpd3solkcx/tmp_20200511T023158_PLD_ORT_PMS_55470...
    long_name:         GREEN
    constellation:     Pleiades
    constellation_id:  PLD
    product_path:      /home/prods/PLEIADES/5547047101/IMG_PHR1A_PMS_001
    product_name:      PHR1A_PMS_202005110231585_ORT_5547047101
    ...                ...
    product_type:      Ortho Single Image
    acquisition_date:  20200511T023158
    condensed_name:    20200511T023158_PLD_ORT_PMS_5547047101
    orbit_direction:   DESCENDING
    radiometry:        reflectance
cloud_cover: 0.0# The nan corresponds to the nodata you see on the footprint
# Plot a subsampled version of the GREEN band
band_ds[GREEN][:, ::10, ::10].plot(robust=True, cmap="mako")
<matplotlib.collections.QuadMesh at 0x7f17246b5c10>
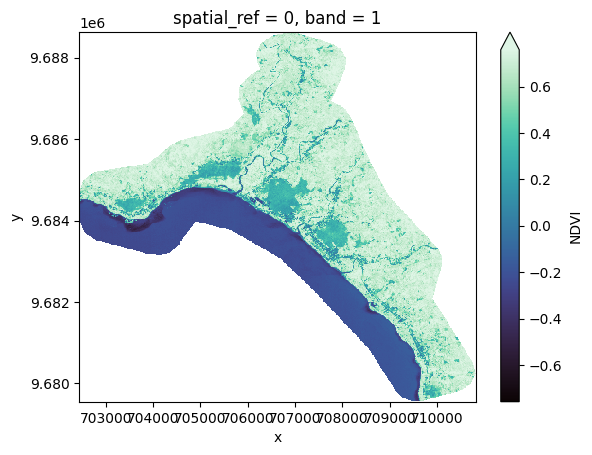
# Plot a subsampled version of the NDVI spectral index
band_ds[NDVI][:, ::10, ::10].plot(robust=True, cmap="mako")
<matplotlib.collections.QuadMesh at 0x7f1724336a90>
# Plot a subsampled version of the CLOUDS: this band is empty
band_ds[CLOUDS][:, ::10, ::10].plot(robust=True, cmap="mako")
<matplotlib.collections.QuadMesh at 0x7f17242a13d0>
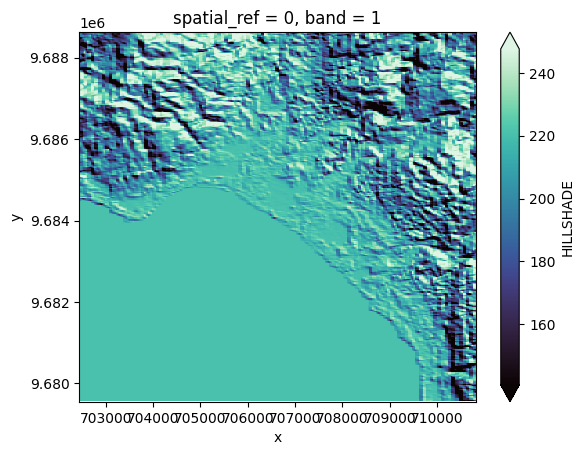
# Plot a subsampled version of the HILLSHADE
band_ds[HILLSHADE][:, ::10, ::10].plot(robust=True, cmap="mako")
<matplotlib.collections.QuadMesh at 0x7f1744728f10>
Stack some bands#
# You can also stack those bands
stack = prod.stack(ok_bands, pixel_size=2.0)
2025-12-23 11:32:31,200 - [DEBUG] - Loading bands ['GREEN', 'NIR', 'RED']
2025-12-23 11:32:31,201 - [DEBUG] - Read GREEN
2025-12-23 11:32:31,219 - [DEBUG] - Read NIR
2025-12-23 11:32:31,237 - [DEBUG] - Read RED
2025-12-23 11:32:31,256 - [DEBUG] - Loading indices ['NDVI']
2025-12-23 11:32:31,273 - [DEBUG] - Loading DEM bands ['HILLSHADE']
2025-12-23 11:32:31,273 - [INFO] - Already existing DEM for /tmp/tmpd3solkcx/tmp_20200511T023158_PLD_ORT_PMS_5547047101/20200511T023158_PLD_ORT_PMS_5547047101_DEM_COPDEM_30m.vrt. Skipping process.
2025-12-23 11:32:31,274 - [DEBUG] - Already existing hillshade DEM for PHR1A_PMS_202005110231585_ORT_5547047101. Skipping process.
2025-12-23 11:32:31,290 - [DEBUG] - Loading Cloud bands ['CLOUDS']
2025-12-23 11:32:31,313 - [DEBUG] - Stacking
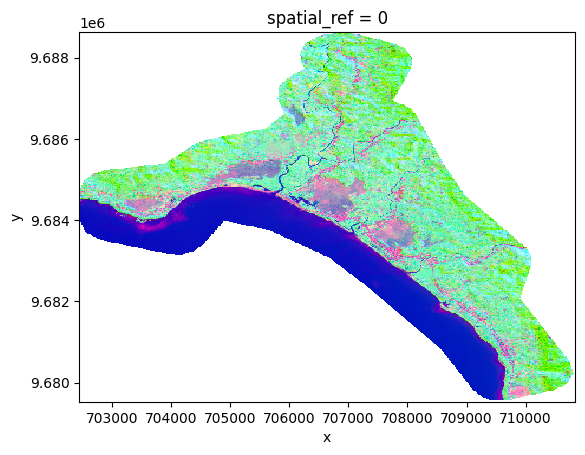
# Plot a subsampled version of the stack
from sertit import display
display_stack = stack[[0, 1, 3], ::10, ::10]  # There is no cloud, don't display it.
display_stack.copy(data=display.scale(display_stack.data)).plot.imshow(robust=True);