
Custom stacks#
Let’s use EOReader with custom stacks.
# EOReader Imports
import os
import xarray as xr
from eoreader.reader import Reader
from eoreader.products import SensorType
from eoreader.bands import BLUE, GREEN, RED, NIR, SWIR_1, VV, VV_DSPK, SLOPE, HILLSHADE
from sertit import display

reader = Reader()
# Create logger
import logging
from sertit import logs

logger = logging.getLogger("eoreader")
logs.init_logger(logger)
# Set a DEM
from eoreader.env_vars import DEM_PATH

os.environ[DEM_PATH] = os.path.join("/home", "data", "DS2", "BASES_DE_DONNEES", "GLOBAL", "COPDEM_30m",
                                    "COPDEM_30m.vrt")
Custom stack with minimum data#
For both SAR and optical stacks, the two minimum keywords to provide are:
band_map: a dictionary mapping the satellite band to the band number (starting to 1, in GDAL style)sensor_type: EitherSARorOPTICAL(a string or a SensorType Enum)
# Paths
stack_folder = os.path.join("/home", "data", "DS3", "CI", "eoreader", "others")
opt_path = os.path.join(stack_folder, "20200310T030415_WV02_Ortho_BGRN_STK.tif")
sar_path = os.path.join(stack_folder, "20210827T162210_ICEYE_SC_GRD_STK.tif")
# Optical minimum example
opt_prod = reader.open(opt_path,
                       custom=True,
                       sensor_type="OPTICAL",  # With a string
                       band_map={BLUE: 1, GREEN: 2, RED: 3, NIR: 4, SWIR_1: 5})
opt_prod
eoreader.CustomProduct '20200310T030415_WV02_Ortho_BGRN_STK'
Attributes:
	condensed_name: 20230322T145628_CUSTOM_CUSTOM
	path: /home/data/DS3/CI/eoreader/others/20200310T030415_WV02_Ortho_BGRN_STK.tif
	constellation: CUSTOM
	sensor type: Optical
	product type: CUSTOM
	default resolution: 7.999924228754893
	acquisition datetime: 2023-03-22T14:56:28.097814
	band mapping:
		BLUE: 1
		GREEN: 2
		RED: 3
		NIR: 4
		SWIR_1: 5
	needs extraction: False
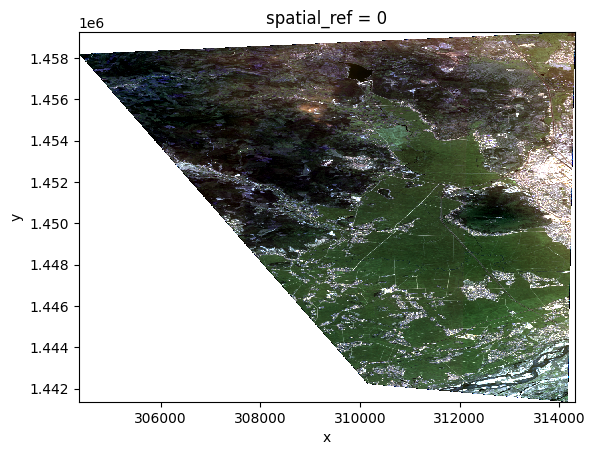
opt_stack = opt_prod.stack([BLUE, GREEN, RED])
2023-03-22 14:56:28,107 - [DEBUG] - Loading bands ['BLUE', 'RED', 'GREEN']
2023-03-22 14:56:28,240 - [DEBUG] - Stacking
2023-03-22 14:56:28,255 - [DEBUG] - Saving stack
xr.plot.imshow(opt_stack.copy(data=display.scale(opt_stack.data)))
/opt/conda/lib/python3.10/site-packages/dask/array/core.py:1712: FutureWarning: The `numpy.nanpercentile` function is not implemented by Dask array. You may want to use the da.map_blocks function or something similar to silence this warning. Your code may stop working in a future release.
  warnings.warn(
<matplotlib.image.AxesImage at 0x7fd7b6a25690>
opt_stack
<xarray.DataArray 'BLUE_GREEN_RED' (z: 3, y: 2237, x: 1244)>
dask.array<transpose, shape=(3, 2237, 1244), dtype=float32, chunksize=(1, 2048, 1244), chunktype=numpy.ndarray>
Coordinates:
  * x            (x) float64 3.044e+05 3.044e+05 ... 3.143e+05 3.143e+05
  * y            (y) float64 1.459e+06 1.459e+06 ... 1.441e+06 1.441e+06
    spatial_ref  int64 0
  * z            (z) object MultiIndex
  * variable     (z) object 'BLUE' 'GREEN' 'RED'
  * band         (z) int64 1 1 1
Attributes:
    long_name:         BLUE GREEN RED
    constellation:     CUSTOM
    constellation_id:  CUSTOM
    product_path:      /home/data/DS3/CI/eoreader/others/20200310T030415_WV02...
    product_name:      20200310T030415_WV02_Ortho_BGRN_STK
    product_filename:  20200310T030415_WV02_Ortho_BGRN_STK
    instrument:        CUSTOM
    product_type:      CUSTOM
    acquisition_date:  20230322T145628
    condensed_name:    20230322T145628_CUSTOM_CUSTOM
orbit_direction: None# SAR minimum example
sar_prod = reader.open(sar_path,
custom=True,
sensor_type=SensorType.SAR, # With the Enum
band_map={VV: 1, VV_DSPK: 2})
sar_prod
eoreader.CustomProduct '20210827T162210_ICEYE_SC_GRD_STK'
Attributes:
	condensed_name: 20230322T145629_CUSTOM_CUSTOM
	path: /home/data/DS3/CI/eoreader/others/20210827T162210_ICEYE_SC_GRD_STK.tif
	constellation: CUSTOM
	sensor type: SAR
	product type: CUSTOM
	default resolution: 47.995955510616774
	acquisition datetime: 2023-03-22T14:56:29.829621
	band mapping:
		VV: 1
		VV_DSPK: 2
	needs extraction: False
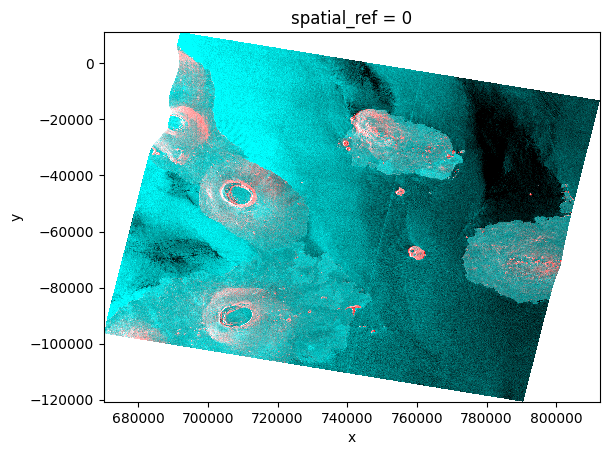
sar_stack = sar_prod.stack([SLOPE, VV, VV_DSPK])
2023-03-22 14:56:29,862 - [DEBUG] - Loading bands ['VV', 'VV_DSPK']
2023-03-22 14:56:29,908 - [DEBUG] - Loading DEM bands ['SLOPE']
2023-03-22 14:56:29,909 - [DEBUG] - Warping DEM for 20230322T145629_CUSTOM_CUSTOM
2023-03-22 14:56:29,912 - [DEBUG] - Using DEM: /home/data/DS2/BASES_DE_DONNEES/GLOBAL/COPDEM_30m/COPDEM_30m.vrt
2023-03-22 14:56:30,529 - [DEBUG] - Computing slope for 20230322T145629_CUSTOM_CUSTOM
2023-03-22 14:56:35,630 - [DEBUG] - Stacking
2023-03-22 14:56:35,646 - [DEBUG] - Saving stack
xr.plot.imshow(sar_stack.copy(data=display.scale(sar_stack.data)))
/opt/conda/lib/python3.10/site-packages/dask/array/core.py:1712: FutureWarning: The `numpy.nanpercentile` function is not implemented by Dask array. You may want to use the da.map_blocks function or something similar to silence this warning. Your code may stop working in a future release.
  warnings.warn(
<matplotlib.image.AxesImage at 0x7fd7b70f4a60>
sar_stack
<xarray.DataArray 'SLOPE_VV_VV_DSPK' (z: 3, y: 2748, x: 2967)>
dask.array<transpose, shape=(3, 2748, 2967), dtype=float32, chunksize=(1, 2048, 2048), chunktype=numpy.ndarray>
Coordinates:
  * x            (x) float64 6.7e+05 6.701e+05 6.701e+05 ... 8.124e+05 8.124e+05
  * y            (y) float64 1.113e+04 1.109e+04 ... -1.206e+05 -1.207e+05
    spatial_ref  int64 0
  * z            (z) object MultiIndex
  * variable     (z) object 'SLOPE' 'VV' 'VV_DSPK'
  * band         (z) int64 1 1 1
Attributes:
    long_name:         SLOPE VV VV_DSPK
    constellation:     CUSTOM
    constellation_id:  CUSTOM
    product_path:      /home/data/DS3/CI/eoreader/others/20210827T162210_ICEY...
    product_name:      20210827T162210_ICEYE_SC_GRD_STK
    product_filename:  20210827T162210_ICEYE_SC_GRD_STK
    instrument:        CUSTOM
    product_type:      CUSTOM
    acquisition_date:  20230322T145635
    condensed_name:    20230322T145629_CUSTOM_CUSTOM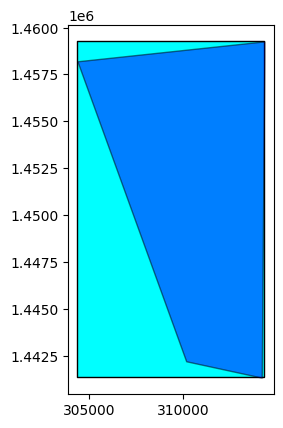
orbit_direction: None# You can compute the footprint and the extent
extent = opt_prod.extent()
footprint = opt_prod.footprint()
base = extent.plot(color='cyan', edgecolor='black')
footprint.plot(ax=base, color='blue', edgecolor='black', alpha=0.5)
<Axes: >
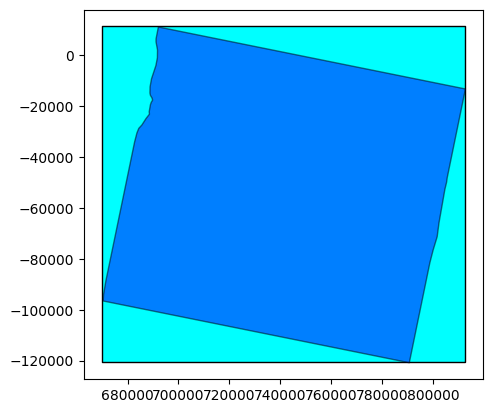
extent = sar_prod.extent()
footprint = sar_prod.footprint()
base = extent.plot(color='cyan', edgecolor='black')
footprint.plot(ax=base, color='blue', edgecolor='black', alpha=0.5)
<Axes: >
Custom stack with full data#
If you know them, it is best to give EOReader all the data you know about your stack:
name: product name. If not provided, the filename will be useddatetime: product acquisition datetime. If not provided, the datetime of the creation of the object will be usedconstellation: product constellation. If not provided,CUSTOMwill be set. Either a string of a Constellation enum.product_type: product type. If not provided,CUSTOMwill be set.resolution: product default resolution. If not provided, the stack resolution will be used.
For optical products, two additional keyword can be set to compute the hillshade band:
sun_azimuthsun_zenith
# Optical
opt_prod = reader.open(
opt_path,
custom=True,
name="20200310T030415_WV02_Ortho",
datetime="20200310T030415",
sensor_type=SensorType.OPTICAL,
constellation="WV02",
product_type="Ortho",
resolution=2.0,
sun_azimuth=10.0,
sun_zenith=20.0,
band_map={BLUE: 1, GREEN: 2, RED: 3, NIR: 4, SWIR_1: 5},
)
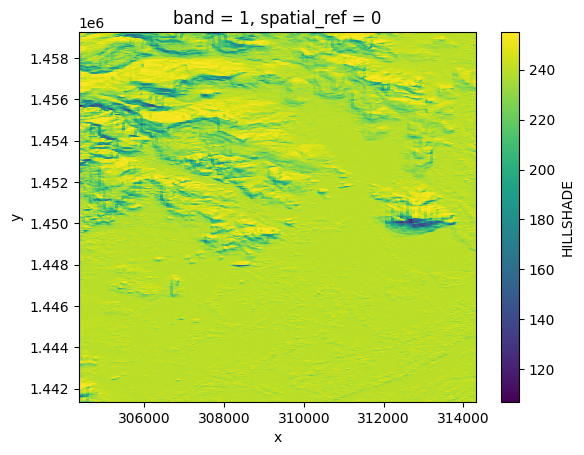
hillshade = opt_prod.load(HILLSHADE)[HILLSHADE]
2023-03-22 14:56:39,820 - [DEBUG] - Loading DEM bands ['HILLSHADE']
2023-03-22 14:56:39,821 - [DEBUG] - Warping DEM for 20200310T030415_WV02_Ortho
2023-03-22 14:56:39,824 - [DEBUG] - Using DEM: /home/data/DS2/BASES_DE_DONNEES/GLOBAL/COPDEM_30m/COPDEM_30m.vrt
2023-03-22 14:56:40,376 - [DEBUG] - Computing hillshade DEM for 20200310T030415_WV02_Ortho
hillshade.plot()
<matplotlib.collections.QuadMesh at 0x7fd79c5352d0>
hillshade
<xarray.DataArray 'HILLSHADE' (band: 1, y: 8948, x: 4976)>
dask.array<where, shape=(1, 8948, 4976), dtype=float32, chunksize=(1, 2048, 2048), chunktype=numpy.ndarray>
Coordinates:
  * band         (band) int64 1
  * x            (x) float64 3.044e+05 3.044e+05 ... 3.143e+05 3.143e+05
  * y            (y) float64 1.459e+06 1.459e+06 ... 1.441e+06 1.441e+06
    spatial_ref  int64 0
Attributes:
    long_name:         HILLSHADE
    constellation:     WorldView-2
    constellation_id:  WV02
    product_path:      /home/data/DS3/CI/eoreader/others/20200310T030415_WV02...
    product_name:      20200310T030415_WV02_Ortho
    product_filename:  20200310T030415_WV02_Ortho_BGRN_STK
    instrument:        CUSTOM
    product_type:      Ortho
    acquisition_date:  20200310T030415
    condensed_name:    20200310T030415_WV02_Ortho
orbit_direction: None# SAR
sar_prod = reader.open(
sar_path,
custom=True,
sensor_type=SensorType.SAR,
name="20210827T162210_ICEYE_SC_GRD",
datetime="20210827T162210",
constellation="ICEYE",
product_type="GRD",
resolution=6.0,
band_map={VV: 1, VV_DSPK: 2},
)
from pprint import pprint
from eoreader import utils

# Read and display metadata
mtd, _ = sar_prod.read_mtd()
pprint(utils.quick_xml_to_dict(mtd))
('custom_metadata',
 {'band_map': "{'VV': 1, 'VV_DSPK': 2}",
  'cloud_cover': 'None',
  'constellation': 'ICEYE',
  'datetime': '2021-08-27T16:22:10',
  'instrument': 'CUSTOM',
  'name': '20210827T162210_ICEYE_SC_GRD',
  'orbit_direction': 'None',
  'product_type': 'GRD',
  'resolution': '6.0',
  'sensor_type': 'SAR',
  'sun_azimuth': 'None',
  'sun_zenith': 'None'})