Basic example
Let’s use EOReader for the first time !
Warning: You will need matplotlib to complete this tutorial
import os

# First of all, we need some satellite data.
# Let's open a lightweight a Landsat-5 MSS collection 2 tile.
path = os.path.abspath("../../CI/DATA/LM05_L1TP_200029_19841014_20200902_02_T2.tar")
from eoreader.reader import Reader

# Create the reader
eoreader = Reader()

# This reader is a singleton can be called once and then open all your data.
# Use it like a logging.getLogger() instance
from eoreader.bands.alias import *

# Open your product
prod = eoreader.open(path) # No need to unzip here
print(prod)
<eoreader.products.optical.l5_product.L5Product object at 0x000001A77EC56E80>
# Here you have opened your product and you have its object in hands
# You can play a little with it to see what it got inside
print(f"Landsat tile: {prod.tile_name}")
print(f"Acquisition datetime: {prod.datetime}")
Landsat tile: 200029
Acquisition datetime: 1984-10-14 10:18:17
# Open here some more interesting geographical data: extent
extent = prod.extent()
extent.geometry.to_crs("EPSG:4326").iat[0]  # Display

# Open here some more interesting geographical data: footprint
footprint = prod.footprint()
footprint.geometry.to_crs("EPSG:4326").iat[0]  # Display

See the difference between footprint and extent hereunder:
Without nodata |
With nodata |
|---|---|
|
|
from eoreader.env_vars import DEM_PATH
# Select the bands you want to load
bands = [GREEN, NDVI, TIR_1, CLOUDS, SHADOWS]

# Compute DEM band only if you have set a DEM in your environment path
if DEM_PATH in os.environ:
    bands.append(HILLSHADE)

# Be sure they exist for Landsat-5 MSS sensor:
ok_bands = [band for band in bands if prod.has_band(band)]
print(to_str(ok_bands)) # Landsat-5 MSS doesn't provide TIR and SHADOWS bands
['GREEN', 'NDVI', 'CLOUDS']
# Load those bands as a dict of xarray.DataArray
band_dict = prod.load(ok_bands)
band_dict[GREEN]
<xarray.DataArray 'LM05_L1TP_200029_19841014_20200902_02_T2' (band: 1, y: 3473, x: 3909)>
array([[[nan, nan, nan, ..., nan, nan, nan],
        [nan, nan, nan, ..., nan, nan, nan],
        [nan, nan, nan, ..., nan, nan, nan],
        ...,
        [nan, nan, nan, ..., nan, nan, nan],
        [nan, nan, nan, ..., nan, nan, nan],
        [nan, nan, nan, ..., nan, nan, nan]]], dtype=float32)
Coordinates:
  * band         (band) int32 1
  * x            (x) float64 5.549e+05 5.55e+05 ... 7.894e+05 7.894e+05
  * y            (y) float64 5.049e+06 5.049e+06 ... 4.841e+06 4.841e+06
    spatial_ref  int32 0
xarray.DataArray
'LM05_L1TP_200029_19841014_20200902_02_T2'
- band: 1
- y: 3473
- x: 3909
- nan nan nan nan nan nan nan nan ... nan nan nan nan nan nan nan nan
array([[[nan, nan, nan, ..., nan, nan, nan], [nan, nan, nan, ..., nan, nan, nan], [nan, nan, nan, ..., nan, nan, nan], ..., [nan, nan, nan, ..., nan, nan, nan], [nan, nan, nan, ..., nan, nan, nan], [nan, nan, nan, ..., nan, nan, nan]]], dtype=float32) - band(band)int321
array([1])
- x(x)float645.549e+05 5.55e+05 ... 7.894e+05
array([554940., 555000., 555060., ..., 789300., 789360., 789420.])
- y(y)float645.049e+06 5.049e+06 ... 4.841e+06
array([5049000., 5048940., 5048880., ..., 4840800., 4840740., 4840680.])
- spatial_ref()int320
- crs_wkt :
- PROJCS["WGS 84 / UTM zone 30N",GEOGCS["WGS 84",DATUM["WGS_1984",SPHEROID["WGS 84",6378137,298.257223563,AUTHORITY["EPSG","7030"]],AUTHORITY["EPSG","6326"]],PRIMEM["Greenwich",0,AUTHORITY["EPSG","8901"]],UNIT["degree",0.0174532925199433,AUTHORITY["EPSG","9122"]],AUTHORITY["EPSG","4326"]],PROJECTION["Transverse_Mercator"],PARAMETER["latitude_of_origin",0],PARAMETER["central_meridian",-3],PARAMETER["scale_factor",0.9996],PARAMETER["false_easting",500000],PARAMETER["false_northing",0],UNIT["metre",1,AUTHORITY["EPSG","9001"]],AXIS["Easting",EAST],AXIS["Northing",NORTH],AUTHORITY["EPSG","32630"]]
- semi_major_axis :
- 6378137.0
- semi_minor_axis :
- 6356752.314245179
- inverse_flattening :
- 298.257223563
- reference_ellipsoid_name :
- WGS 84
- longitude_of_prime_meridian :
- 0.0
- prime_meridian_name :
- Greenwich
- geographic_crs_name :
- WGS 84
- horizontal_datum_name :
- World Geodetic System 1984
- projected_crs_name :
- WGS 84 / UTM zone 30N
- grid_mapping_name :
- transverse_mercator
- latitude_of_projection_origin :
- 0.0
- longitude_of_central_meridian :
- -3.0
- false_easting :
- 500000.0
- false_northing :
- 0.0
- scale_factor_at_central_meridian :
- 0.9996
- spatial_ref :
- PROJCS["WGS 84 / UTM zone 30N",GEOGCS["WGS 84",DATUM["WGS_1984",SPHEROID["WGS 84",6378137,298.257223563,AUTHORITY["EPSG","7030"]],AUTHORITY["EPSG","6326"]],PRIMEM["Greenwich",0,AUTHORITY["EPSG","8901"]],UNIT["degree",0.0174532925199433,AUTHORITY["EPSG","9122"]],AUTHORITY["EPSG","4326"]],PROJECTION["Transverse_Mercator"],PARAMETER["latitude_of_origin",0],PARAMETER["central_meridian",-3],PARAMETER["scale_factor",0.9996],PARAMETER["false_easting",500000],PARAMETER["false_northing",0],UNIT["metre",1,AUTHORITY["EPSG","9001"]],AXIS["Easting",EAST],AXIS["Northing",NORTH],AUTHORITY["EPSG","32630"]]
- GeoTransform :
- 554910.0 60.0 0.0 5049030.0 0.0 -60.0
array(0)
# The nan corresponds to the nodata you see on the footprint
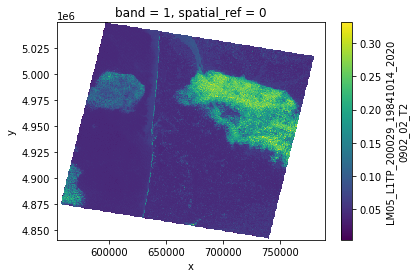
%matplotlib inline
# Plot a subsampled version
band_dict[GREEN][:, ::10, ::10].plot()
<matplotlib.collections.QuadMesh at 0x1a727b21f98>
# Plot a subsampled version
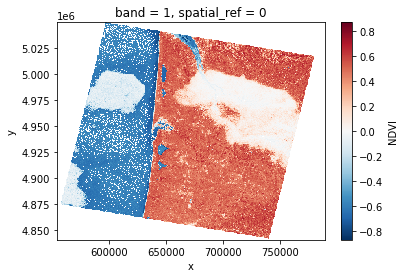
band_dict[NDVI][:, ::10, ::10].plot()
<matplotlib.collections.QuadMesh at 0x1a727ca2f28>
# Plot a subsampled version
if HILLSHADE in band_dict:
    band_dict[HILLSHADE][:, ::10, ::10].plot()
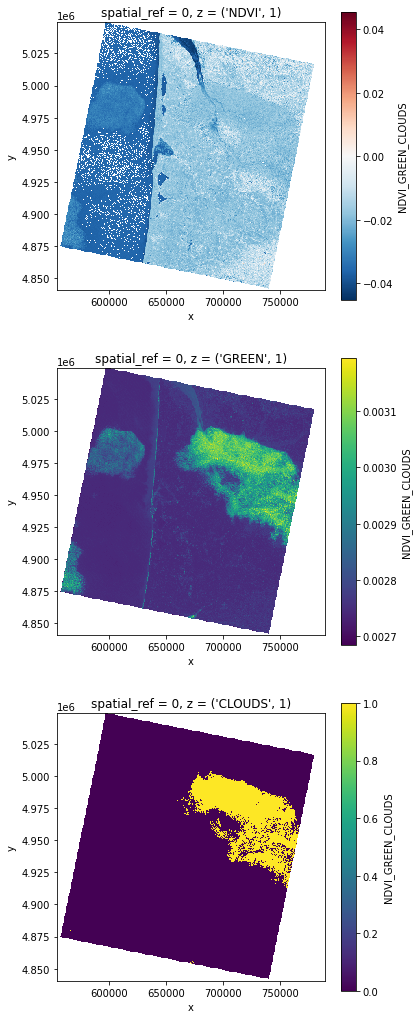
# You can also stack those bands
stack = prod.stack(ok_bands)
stack
<xarray.DataArray 'NDVI_GREEN_CLOUDS' (z: 3, y: 3473, x: 3909)>
array([[[nan, nan, nan, ..., nan, nan, nan],
        [nan, nan, nan, ..., nan, nan, nan],
        [nan, nan, nan, ..., nan, nan, nan],
        ...,
        [nan, nan, nan, ..., nan, nan, nan],
        [nan, nan, nan, ..., nan, nan, nan],
        [nan, nan, nan, ..., nan, nan, nan]],

       [[nan, nan, nan, ..., nan, nan, nan],
        [nan, nan, nan, ..., nan, nan, nan],
        [nan, nan, nan, ..., nan, nan, nan],
        ...,
        [nan, nan, nan, ..., nan, nan, nan],
        [nan, nan, nan, ..., nan, nan, nan],
        [nan, nan, nan, ..., nan, nan, nan]],

       [[nan, nan, nan, ..., nan, nan, nan],
        [nan, nan, nan, ..., nan, nan, nan],
        [nan, nan, nan, ..., nan, nan, nan],
        ...,
        [nan, nan, nan, ..., nan, nan, nan],
        [nan, nan, nan, ..., nan, nan, nan],
        [nan, nan, nan, ..., nan, nan, nan]]], dtype=float32)
Coordinates:
    spatial_ref  int32 0
  * x            (x) float64 5.549e+05 5.55e+05 ... 7.894e+05 7.894e+05
  * y            (y) float64 5.049e+06 5.049e+06 ... 4.841e+06 4.841e+06
  * z            (z) MultiIndex
  - variable     (z) object 'NDVI' 'GREEN' 'CLOUDS'
  - band         (z) int64 1 1 1
Attributes:
    long_name:  ['NDVI', 'GREEN', 'CLOUDS']
xarray.DataArray
'NDVI_GREEN_CLOUDS'
- z: 3
- y: 3473
- x: 3909
- nan nan nan nan nan nan nan nan ... nan nan nan nan nan nan nan nan
array([[[nan, nan, nan, ..., nan, nan, nan], [nan, nan, nan, ..., nan, nan, nan], [nan, nan, nan, ..., nan, nan, nan], ..., [nan, nan, nan, ..., nan, nan, nan], [nan, nan, nan, ..., nan, nan, nan], [nan, nan, nan, ..., nan, nan, nan]], [[nan, nan, nan, ..., nan, nan, nan], [nan, nan, nan, ..., nan, nan, nan], [nan, nan, nan, ..., nan, nan, nan], ..., [nan, nan, nan, ..., nan, nan, nan], [nan, nan, nan, ..., nan, nan, nan], [nan, nan, nan, ..., nan, nan, nan]], [[nan, nan, nan, ..., nan, nan, nan], [nan, nan, nan, ..., nan, nan, nan], [nan, nan, nan, ..., nan, nan, nan], ..., [nan, nan, nan, ..., nan, nan, nan], [nan, nan, nan, ..., nan, nan, nan], [nan, nan, nan, ..., nan, nan, nan]]], dtype=float32) - spatial_ref()int320
- crs_wkt :
- PROJCS["WGS 84 / UTM zone 30N",GEOGCS["WGS 84",DATUM["WGS_1984",SPHEROID["WGS 84",6378137,298.257223563,AUTHORITY["EPSG","7030"]],AUTHORITY["EPSG","6326"]],PRIMEM["Greenwich",0,AUTHORITY["EPSG","8901"]],UNIT["degree",0.0174532925199433,AUTHORITY["EPSG","9122"]],AUTHORITY["EPSG","4326"]],PROJECTION["Transverse_Mercator"],PARAMETER["latitude_of_origin",0],PARAMETER["central_meridian",-3],PARAMETER["scale_factor",0.9996],PARAMETER["false_easting",500000],PARAMETER["false_northing",0],UNIT["metre",1,AUTHORITY["EPSG","9001"]],AXIS["Easting",EAST],AXIS["Northing",NORTH],AUTHORITY["EPSG","32630"]]
- semi_major_axis :
- 6378137.0
- semi_minor_axis :
- 6356752.314245179
- inverse_flattening :
- 298.257223563
- reference_ellipsoid_name :
- WGS 84
- longitude_of_prime_meridian :
- 0.0
- prime_meridian_name :
- Greenwich
- geographic_crs_name :
- WGS 84
- horizontal_datum_name :
- World Geodetic System 1984
- projected_crs_name :
- WGS 84 / UTM zone 30N
- grid_mapping_name :
- transverse_mercator
- latitude_of_projection_origin :
- 0.0
- longitude_of_central_meridian :
- -3.0
- false_easting :
- 500000.0
- false_northing :
- 0.0
- scale_factor_at_central_meridian :
- 0.9996
- spatial_ref :
- PROJCS["WGS 84 / UTM zone 30N",GEOGCS["WGS 84",DATUM["WGS_1984",SPHEROID["WGS 84",6378137,298.257223563,AUTHORITY["EPSG","7030"]],AUTHORITY["EPSG","6326"]],PRIMEM["Greenwich",0,AUTHORITY["EPSG","8901"]],UNIT["degree",0.0174532925199433,AUTHORITY["EPSG","9122"]],AUTHORITY["EPSG","4326"]],PROJECTION["Transverse_Mercator"],PARAMETER["latitude_of_origin",0],PARAMETER["central_meridian",-3],PARAMETER["scale_factor",0.9996],PARAMETER["false_easting",500000],PARAMETER["false_northing",0],UNIT["metre",1,AUTHORITY["EPSG","9001"]],AXIS["Easting",EAST],AXIS["Northing",NORTH],AUTHORITY["EPSG","32630"]]
- GeoTransform :
- 554910.0 60.0 0.0 5049030.0 0.0 -60.0
array(0)
- x(x)float645.549e+05 5.55e+05 ... 7.894e+05
array([554940., 555000., 555060., ..., 789300., 789360., 789420.])
- y(y)float645.049e+06 5.049e+06 ... 4.841e+06
array([5049000., 5048940., 5048880., ..., 4840800., 4840740., 4840680.])
- z(z)MultiIndex(variable, band)
array([('NDVI', 1), ('GREEN', 1), ('CLOUDS', 1)], dtype=object) - variable(z)object'NDVI' 'GREEN' 'CLOUDS'
array(['NDVI', 'GREEN', 'CLOUDS'], dtype=object)
- band(z)int641 1 1
array([1, 1, 1], dtype=int64)
- long_name :
- ['NDVI', 'GREEN', 'CLOUDS']
# Error in plotting with a list
if "long_name" in stack.attrs:
    stack.attrs.pop("long_name")

# Plot a subsampled version
import matplotlib.pyplot as plt
nrows = len(stack)
fig, axes = plt.subplots(nrows=nrows, figsize=(2*nrows, 6*nrows), subplot_kw={"box_aspect": 1})  # Square plots
for i in range(nrows):
    stack[i, ::10, ::10].plot(x="x", y="y", ax=axes[i])