VHR example
Let’s use EOReader with Very High Resolution data.
Warning:
import os
import glob

# First of all, we need some VHR data, let's use Pleiades data
path = os.path.abspath(glob.glob(os.path.join("/", "*", "DATA", "PRODS", "PLEIADES", "5547047101", "IMG_PHR1A_PMS_001"))[0])
# Create logger
import logging

logger = logging.getLogger("eoreader")
logger.setLevel(logging.INFO)

# create console handler and set level to debug
ch = logging.StreamHandler()
ch.setLevel(logging.INFO)

# create formatter
formatter = logging.Formatter('%(message)s')

# add formatter to ch
ch.setFormatter(formatter)

# add ch to logger
logger.addHandler(ch)
from eoreader.reader import Reader

# Create the reader
eoreader = Reader()
from eoreader.bands.alias import *

# Open your product
prod = eoreader.open(path)
print(f"Acquisition datetime: {prod.datetime}")
print(f"Condensed name: {prod.condensed_name}")

# Please be aware that EOReader will always work in UTM projection, so if you give WGS84 data,
# EOReader will reproject the stacks and this can be time consuming
Acquisition datetime: 2020-05-11 02:31:58
Condensed name: 20200511T023158_PLD_ORT_PMS
# Here, if you want to orthorectify or pansharpen your data manually, you can set your stack here.
# If you do not provide this stack but you give a non-orthorectified product to EOReader
# (ie. SEN or PRJ products for Pleiades), you must provide a DEM to orthorectify correctly the data
# prod.ortho_stack = ""
from eoreader.env_vars import DEM_PATH
os.environ[DEM_PATH] = os.path.abspath(glob.glob(os.path.join("/", "*", "DS2", "BASES_DE_DONNEES", "GLOBAL", "MERIT_Hydrologically_Adjusted_Elevations", "MERIT_DEM.vrt"))[0])
# Open here some more interesting geographical data: extent
extent = prod.extent()
extent.geometry.to_crs("EPSG:4326").iat[0]  # Display

# Open here some more interesting geographical data: footprint
footprint = prod.footprint()
footprint.geometry.to_crs("EPSG:4326").iat[0]  # Display

# Select the bands you want to load
bands = [GREEN, NDVI, TIR_1, CLOUDS, HILLSHADE]

# Be sure they exist for Pleiades sensor:
ok_bands = [band for band in bands if prod.has_band(band)]
print(to_str(ok_bands)) # Pleiades doesn't provide TIR and SHADOWS bands
['GREEN', 'NDVI', 'CLOUDS', 'HILLSHADE']
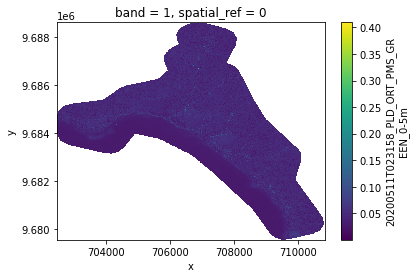
# Load those bands as a dict of xarray.DataArray
band_dict = prod.load(ok_bands)
band_dict[GREEN]
Reprojecting band RED to UTM with a 0.5 m resolution.
Reprojecting band NIR to UTM with a 0.5 m resolution.
Reprojecting band GREEN to UTM with a 0.5 m resolution.
<xarray.DataArray '20200511T023158_PLD_ORT_PMS_GREEN_0-5m' (band: 1, y: 18124, x: 16754)>
array([[[nan, nan, nan, ..., nan, nan, nan],
        [nan, nan, nan, ..., nan, nan, nan],
        [nan, nan, nan, ..., nan, nan, nan],
        ...,
        [nan, nan, nan, ..., nan, nan, nan],
        [nan, nan, nan, ..., nan, nan, nan],
        [nan, nan, nan, ..., nan, nan, nan]]], dtype=float32)
Coordinates:
  * band         (band) int32 1
  * x            (x) float64 7.024e+05 7.024e+05 ... 7.108e+05 7.108e+05
  * y            (y) float64 9.689e+06 9.689e+06 9.689e+06 ... 9.68e+06 9.68e+06
    spatial_ref  int32 0
Attributes:
    scale_factor:  1.0
    add_offset:    0.0
xarray.DataArray
'20200511T023158_PLD_ORT_PMS_GREEN_0-5m'
- band: 1
- y: 18124
- x: 16754
- nan nan nan nan nan nan nan nan ... nan nan nan nan nan nan nan nan
array([[[nan, nan, nan, ..., nan, nan, nan], [nan, nan, nan, ..., nan, nan, nan], [nan, nan, nan, ..., nan, nan, nan], ..., [nan, nan, nan, ..., nan, nan, nan], [nan, nan, nan, ..., nan, nan, nan], [nan, nan, nan, ..., nan, nan, nan]]], dtype=float32) - band(band)int321
array([1])
- x(x)float647.024e+05 7.024e+05 ... 7.108e+05
array([702448.662765, 702449.162765, 702449.662765, ..., 710824.162765, 710824.662765, 710825.162765]) - y(y)float649.689e+06 9.689e+06 ... 9.68e+06
array([9688620.534414, 9688620.034414, 9688619.534414, ..., 9679560.034414, 9679559.534414, 9679559.034414]) - spatial_ref()int320
- crs_wkt :
- PROJCS["WGS 84 / UTM zone 50S",GEOGCS["WGS 84",DATUM["WGS_1984",SPHEROID["WGS 84",6378137,298.257223563,AUTHORITY["EPSG","7030"]],AUTHORITY["EPSG","6326"]],PRIMEM["Greenwich",0,AUTHORITY["EPSG","8901"]],UNIT["degree",0.0174532925199433,AUTHORITY["EPSG","9122"]],AUTHORITY["EPSG","4326"]],PROJECTION["Transverse_Mercator"],PARAMETER["latitude_of_origin",0],PARAMETER["central_meridian",117],PARAMETER["scale_factor",0.9996],PARAMETER["false_easting",500000],PARAMETER["false_northing",10000000],UNIT["metre",1,AUTHORITY["EPSG","9001"]],AXIS["Easting",EAST],AXIS["Northing",NORTH],AUTHORITY["EPSG","32750"]]
- semi_major_axis :
- 6378137.0
- semi_minor_axis :
- 6356752.314245179
- inverse_flattening :
- 298.257223563
- reference_ellipsoid_name :
- WGS 84
- longitude_of_prime_meridian :
- 0.0
- prime_meridian_name :
- Greenwich
- geographic_crs_name :
- WGS 84
- horizontal_datum_name :
- World Geodetic System 1984
- projected_crs_name :
- WGS 84 / UTM zone 50S
- grid_mapping_name :
- transverse_mercator
- latitude_of_projection_origin :
- 0.0
- longitude_of_central_meridian :
- 117.0
- false_easting :
- 500000.0
- false_northing :
- 10000000.0
- scale_factor_at_central_meridian :
- 0.9996
- spatial_ref :
- PROJCS["WGS 84 / UTM zone 50S",GEOGCS["WGS 84",DATUM["WGS_1984",SPHEROID["WGS 84",6378137,298.257223563,AUTHORITY["EPSG","7030"]],AUTHORITY["EPSG","6326"]],PRIMEM["Greenwich",0,AUTHORITY["EPSG","8901"]],UNIT["degree",0.0174532925199433,AUTHORITY["EPSG","9122"]],AUTHORITY["EPSG","4326"]],PROJECTION["Transverse_Mercator"],PARAMETER["latitude_of_origin",0],PARAMETER["central_meridian",117],PARAMETER["scale_factor",0.9996],PARAMETER["false_easting",500000],PARAMETER["false_northing",10000000],UNIT["metre",1,AUTHORITY["EPSG","9001"]],AXIS["Easting",EAST],AXIS["Northing",NORTH],AUTHORITY["EPSG","32750"]]
- GeoTransform :
- 702448.4127654727 0.5 0.0 9688620.784413863 0.0 -0.5
array(0)
- scale_factor :
- 1.0
- add_offset :
- 0.0
# The nan corresponds to the nodata you see on the footprint
%matplotlib inline

# Plot a subsampled version
band_dict[GREEN][:, ::10, ::10].plot()
<matplotlib.collections.QuadMesh at 0x220c7ce6240>
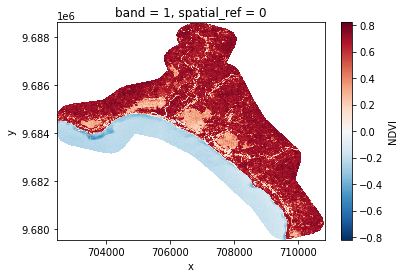
# Plot a subsampled version
band_dict[NDVI][:, ::10, ::10].plot()
<matplotlib.collections.QuadMesh at 0x220c7aa2f98>
# Plot a subsampled version
band_dict[CLOUDS][:, ::10, ::10].plot()
<matplotlib.collections.QuadMesh at 0x220c7b76c50>

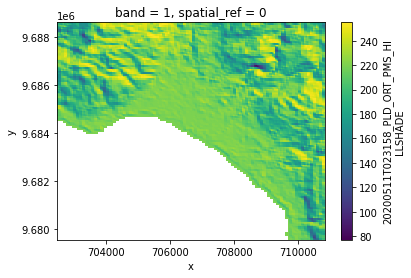
# Plot a subsampled version
band_dict[HILLSHADE][:, ::10, ::10].plot()
<matplotlib.collections.QuadMesh at 0x220c7c38f60>
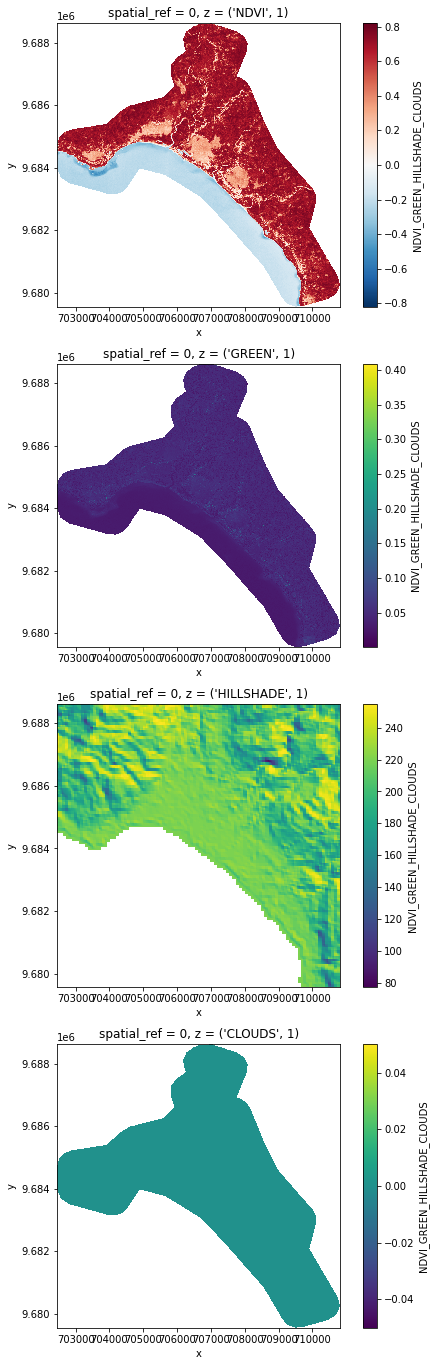
# You can also stack those bands
stack = prod.stack(ok_bands)
stack
<xarray.DataArray 'NDVI_GREEN_HILLSHADE_CLOUDS' (z: 4, y: 18124, x: 16754)>
array([[[ nan,  nan,  nan, ...,  nan,  nan,  nan],
        [ nan,  nan,  nan, ...,  nan,  nan,  nan],
        [ nan,  nan,  nan, ...,  nan,  nan,  nan],
        ...,
        [ nan,  nan,  nan, ...,  nan,  nan,  nan],
        [ nan,  nan,  nan, ...,  nan,  nan,  nan],
        [ nan,  nan,  nan, ...,  nan,  nan,  nan]],

       [[ nan,  nan,  nan, ...,  nan,  nan,  nan],
        [ nan,  nan,  nan, ...,  nan,  nan,  nan],
        [ nan,  nan,  nan, ...,  nan,  nan,  nan],
        ...,
        [ nan,  nan,  nan, ...,  nan,  nan,  nan],
        [ nan,  nan,  nan, ...,  nan,  nan,  nan],
        [ nan,  nan,  nan, ...,  nan,  nan,  nan]],

       [[217., 203., 203., ..., 193., 193., 213.],
        [203., 203., 203., ..., 193., 193., 193.],
        [203., 203., 203., ..., 193., 193., 193.],
        ...,
        [ nan,  nan,  nan, ..., 174., 174., 174.],
        [ nan,  nan,  nan, ..., 176., 176., 176.],
        [ nan,  nan,  nan, ..., 177., 177., 196.]],

       [[ nan,  nan,  nan, ...,  nan,  nan,  nan],
        [ nan,  nan,  nan, ...,  nan,  nan,  nan],
        [ nan,  nan,  nan, ...,  nan,  nan,  nan],
        ...,
        [ nan,  nan,  nan, ...,  nan,  nan,  nan],
        [ nan,  nan,  nan, ...,  nan,  nan,  nan],
        [ nan,  nan,  nan, ...,  nan,  nan,  nan]]], dtype=float32)
Coordinates:
    spatial_ref  int32 0
  * x            (x) float64 7.024e+05 7.024e+05 ... 7.108e+05 7.108e+05
  * y            (y) float64 9.689e+06 9.689e+06 9.689e+06 ... 9.68e+06 9.68e+06
  * z            (z) MultiIndex
  - variable     (z) object 'NDVI' 'GREEN' 'HILLSHADE' 'CLOUDS'
  - band         (z) int64 1 1 1 1
Attributes:
    long_name:  ['NDVI', 'GREEN', 'HILLSHADE', 'CLOUDS']
xarray.DataArray
'NDVI_GREEN_HILLSHADE_CLOUDS'
- z: 4
- y: 18124
- x: 16754
- nan nan nan nan nan nan nan nan ... nan nan nan nan nan nan nan nan
array([[[ nan, nan, nan, ..., nan, nan, nan], [ nan, nan, nan, ..., nan, nan, nan], [ nan, nan, nan, ..., nan, nan, nan], ..., [ nan, nan, nan, ..., nan, nan, nan], [ nan, nan, nan, ..., nan, nan, nan], [ nan, nan, nan, ..., nan, nan, nan]], [[ nan, nan, nan, ..., nan, nan, nan], [ nan, nan, nan, ..., nan, nan, nan], [ nan, nan, nan, ..., nan, nan, nan], ..., [ nan, nan, nan, ..., nan, nan, nan], [ nan, nan, nan, ..., nan, nan, nan], [ nan, nan, nan, ..., nan, nan, nan]], [[217., 203., 203., ..., 193., 193., 213.], [203., 203., 203., ..., 193., 193., 193.], [203., 203., 203., ..., 193., 193., 193.], ..., [ nan, nan, nan, ..., 174., 174., 174.], [ nan, nan, nan, ..., 176., 176., 176.], [ nan, nan, nan, ..., 177., 177., 196.]], [[ nan, nan, nan, ..., nan, nan, nan], [ nan, nan, nan, ..., nan, nan, nan], [ nan, nan, nan, ..., nan, nan, nan], ..., [ nan, nan, nan, ..., nan, nan, nan], [ nan, nan, nan, ..., nan, nan, nan], [ nan, nan, nan, ..., nan, nan, nan]]], dtype=float32) - spatial_ref()int320
- crs_wkt :
- PROJCS["WGS 84 / UTM zone 50S",GEOGCS["WGS 84",DATUM["WGS_1984",SPHEROID["WGS 84",6378137,298.257223563,AUTHORITY["EPSG","7030"]],AUTHORITY["EPSG","6326"]],PRIMEM["Greenwich",0,AUTHORITY["EPSG","8901"]],UNIT["degree",0.0174532925199433,AUTHORITY["EPSG","9122"]],AUTHORITY["EPSG","4326"]],PROJECTION["Transverse_Mercator"],PARAMETER["latitude_of_origin",0],PARAMETER["central_meridian",117],PARAMETER["scale_factor",0.9996],PARAMETER["false_easting",500000],PARAMETER["false_northing",10000000],UNIT["metre",1,AUTHORITY["EPSG","9001"]],AXIS["Easting",EAST],AXIS["Northing",NORTH],AUTHORITY["EPSG","32750"]]
- semi_major_axis :
- 6378137.0
- semi_minor_axis :
- 6356752.314245179
- inverse_flattening :
- 298.257223563
- reference_ellipsoid_name :
- WGS 84
- longitude_of_prime_meridian :
- 0.0
- prime_meridian_name :
- Greenwich
- geographic_crs_name :
- WGS 84
- horizontal_datum_name :
- World Geodetic System 1984
- projected_crs_name :
- WGS 84 / UTM zone 50S
- grid_mapping_name :
- transverse_mercator
- latitude_of_projection_origin :
- 0.0
- longitude_of_central_meridian :
- 117.0
- false_easting :
- 500000.0
- false_northing :
- 10000000.0
- scale_factor_at_central_meridian :
- 0.9996
- spatial_ref :
- PROJCS["WGS 84 / UTM zone 50S",GEOGCS["WGS 84",DATUM["WGS_1984",SPHEROID["WGS 84",6378137,298.257223563,AUTHORITY["EPSG","7030"]],AUTHORITY["EPSG","6326"]],PRIMEM["Greenwich",0,AUTHORITY["EPSG","8901"]],UNIT["degree",0.0174532925199433,AUTHORITY["EPSG","9122"]],AUTHORITY["EPSG","4326"]],PROJECTION["Transverse_Mercator"],PARAMETER["latitude_of_origin",0],PARAMETER["central_meridian",117],PARAMETER["scale_factor",0.9996],PARAMETER["false_easting",500000],PARAMETER["false_northing",10000000],UNIT["metre",1,AUTHORITY["EPSG","9001"]],AXIS["Easting",EAST],AXIS["Northing",NORTH],AUTHORITY["EPSG","32750"]]
- GeoTransform :
- 702448.4127654727 0.5 0.0 9688620.784413863 0.0 -0.5
array(0)
- x(x)float647.024e+05 7.024e+05 ... 7.108e+05
array([702448.662765, 702449.162765, 702449.662765, ..., 710824.162765, 710824.662765, 710825.162765]) - y(y)float649.689e+06 9.689e+06 ... 9.68e+06
array([9688620.534414, 9688620.034414, 9688619.534414, ..., 9679560.034414, 9679559.534414, 9679559.034414]) - z(z)MultiIndex(variable, band)
array([('NDVI', 1), ('GREEN', 1), ('HILLSHADE', 1), ('CLOUDS', 1)], dtype=object) - variable(z)object'NDVI' 'GREEN' 'HILLSHADE' 'CLOUDS'
array(['NDVI', 'GREEN', 'HILLSHADE', 'CLOUDS'], dtype=object)
- band(z)int641 1 1 1
array([1, 1, 1, 1], dtype=int64)
- long_name :
- ['NDVI', 'GREEN', 'HILLSHADE', 'CLOUDS']
# Error in plotting with a list
if "long_name" in stack.attrs:
    stack.attrs.pop("long_name")

# Plot a subsampled version
import matplotlib.pyplot as plt
nrows = len(stack)
fig, axes = plt.subplots(nrows=nrows, figsize=(2*nrows, 6*nrows), subplot_kw={"box_aspect": 1})
for i in range(nrows):
    stack[i, ::10, ::10].plot(x="x", y="y", ax=axes[i])